Solar PV is often criticized for not being a consistent or reliable source of energy. The sun doesn’t always shine when we need it, and it can be difficult or impossible to accurately predict short-term performance because it is strongly influenced by the weather. However if one were to take a step back and evaluate over the long-term they may find that there is a high degree of consistency in the performance of solar PV systems. In this article I am going to do some statistical analysis on production data one of the first systems we installed.
About the solar array
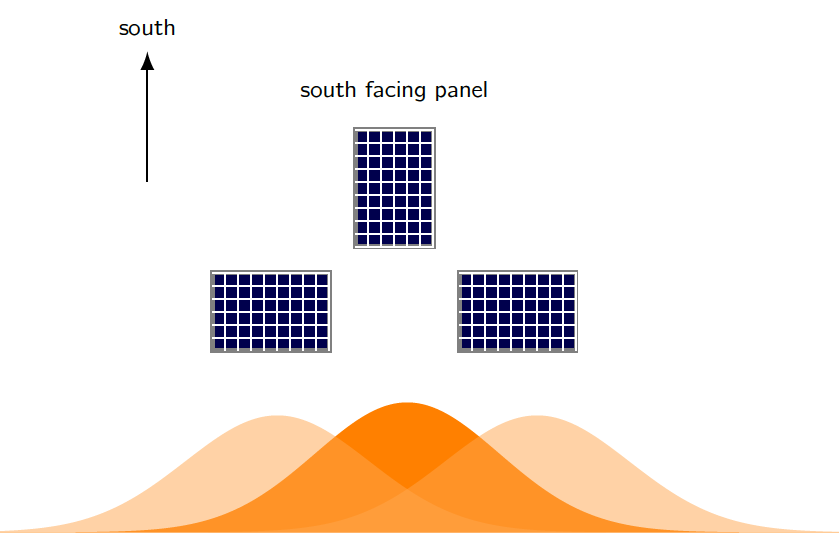
The system is located in Calgary. The array is flush mounted and made up of two sub-arrays of four modules, one facing SW with a true direction of 225 degrees; the other is facing SE with a direction of 135 degrees. Both sub arrays have a pitch of 4/12 or a tilt of 18 degrees. The system was commissioned in August 2014 so there are three full sets of annual data to analyze. The array experiences a little bit of shading and hasn’t experienced any serious power outages.
Annual energy production is highly consistent
Below are charts depicting the annual energy production of each module in 2015, 2016 and 2017. We can see that some modules consistently produce more or less energy than adjacent modules. This can be attributed to shading and surface temperature variation. Having said that the system’s total annual production is incredibly consistent. The system produced a total of:
- 2,287 kilowatt-hours in 2015,
- 2,218 kWh in 2016, and
- 2,141 kWh in 2017.
These numbers yield a mean of 2,216kWh and a coefficient of variation of only 3%. Assuming performance is normal we can be:
- 95% confident that next year’s energy production will be between 2,070kWh and 2,360kWh, or we can be
- 99.5% confident that it will be between 2,000kWh and 2,450kWh.
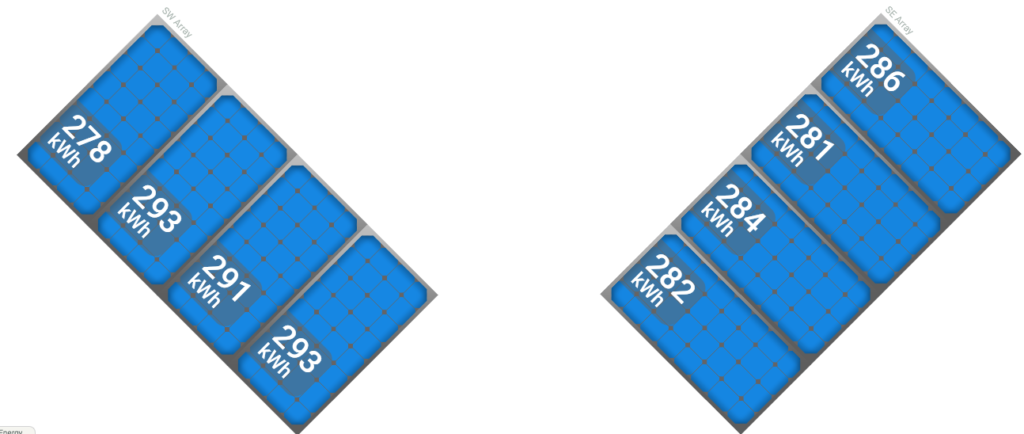
2015 solar production
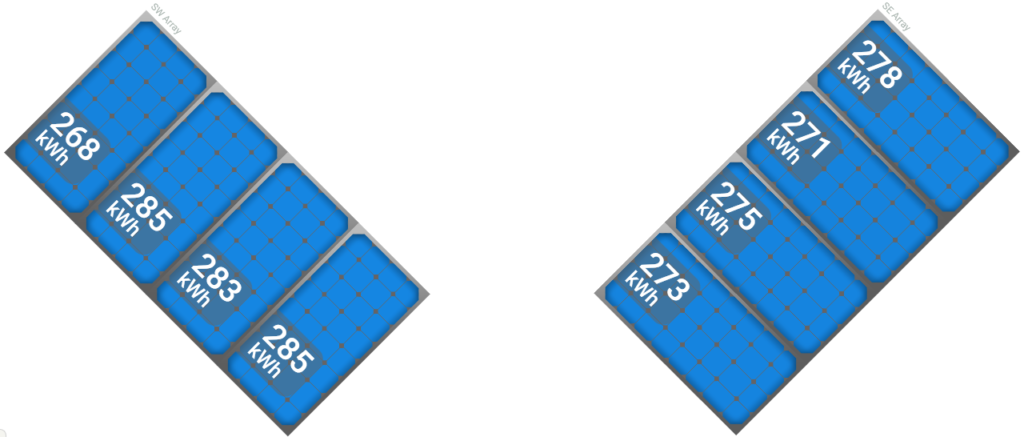
2016 solar production
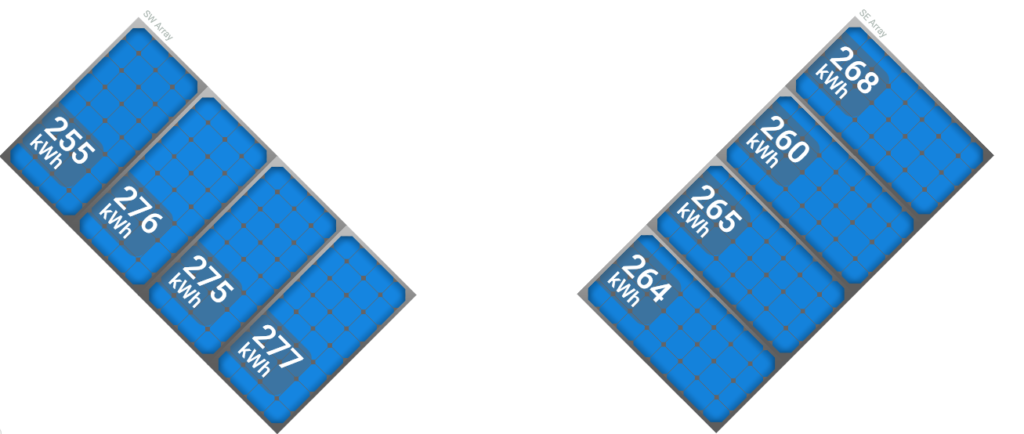
2017 solar production
Methodology
- I collected four data points for each month for all months except for June, July and August which have only three data points each.
- Data was not corrected for cell degradation. You may have noticed that the total and modular annual energy production has been decreasing year by year, but it’s too early to relate this to cell degradation.
- Monthly averages are a mean of the monthly production data.
- Monthly coefficients of variation are calculated in order to compare variation in production. A dataset with a higher COV means that it’s less predictable.
Results
In red below is the ratio of a month’s mean production to annual mean production, whilst the blue represents the month’s COV.
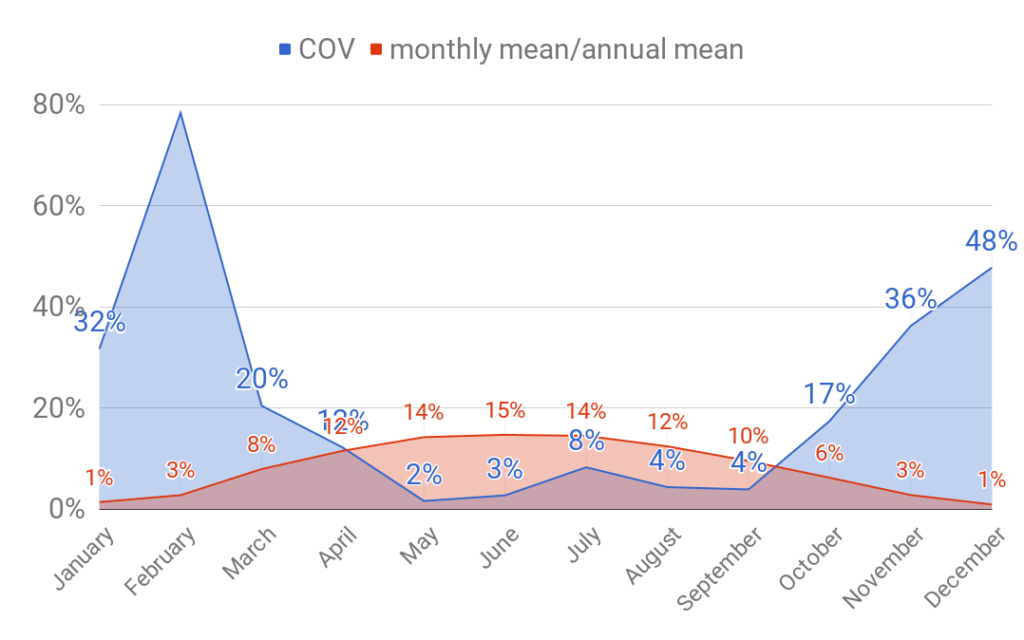
Observations
- The summer months May, June and July each produced about one-seventh of the average annual production, which will be called ‘annual’.
- May to September have an incredibly high consistency. For example the month of May has produced a total of 318kWh in 2015, 308kWh in 2016, 316kWh in 2017, and 319kWh in 2018, yielding a COV of only 2%.
- Production from December up to and including February accounts for about 5% of annual.
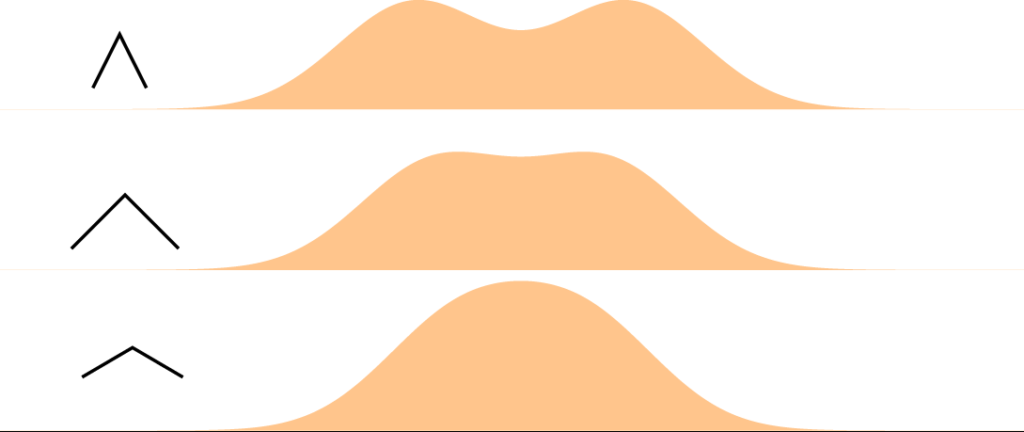
- The COV and monthly mean curve seem to be opposite one another. The higher the mean, the lower the COV and vice versa. Production is a lot more consistent between May and September than it is in the winter. But is this high winter variance really a problem?
- Winter has a higher variance, but because there is very little production its influence is limited. For example, a COV of 32% for the month of January means that we are 95% confident that production to be between 0.5% and 2.3%. The bottom line is the amount of energy is negligible and will be absorbed by a design margin.
- On the other hand, June makes up for about 15% of the energy and it has a COV of 3%. This translates to a 95% confidence that production is going to be between 14% and 15% of annual. That is a higher quality prediction, and an important one as well because of the amount of energy it accounts for.
Conclusion
We only analyzed four years of a system that is expected to stay in operation for 25 years. Therefore this analysis is still in its infancy. However I think it puts the question of reliability of solar PV in a good light. When looked at from a monthly or annual basis, solar PV seems to be a consistent energy source. Or at least one can say that this approach enables stand-alone system designers to efficiently communicate and justify generation and storage capacities. With probabilistic data a system’s size can be based on a client’s appetite for risk. Of course grid operators will still require short term forecasting as more solar is adopted across their jurisdictions, and a model based on observed data alone has its limitations.
I wrote an article about averages in the context of off-grid systems showing how it is favourable to use longer measuring intervals because they evolve to normal distributions with low variance i.e. higher quality.
May the power of averages be with you.
Click here for a .pdf of this article.