One in four new car purchases in BC today is an electric vehicle (EV), and with the Lower Mainland’s high concentration of apartment and condo buildings, more parkades will inevitably need electrification. If you’ve ever seen a parkade full of EVs, you might assume that charging them requires a massive electrical service. Sure, a transmission-connected community centre or IKEA can support a dozen level 2 chargers and a couple level 3 fast chargers on demand, but many apartment and condo buildings are still supported by relatively small transformers and aging distribution grids. In this article, I’ll explain how residential parkades can still maintain EVs with limited electrical supplies and introduce a simulator we developed that helps building managers determine the optimal supply capacity for EV charging in residential parkades before committing to any costly electrical upgrades.
Why switch to EV
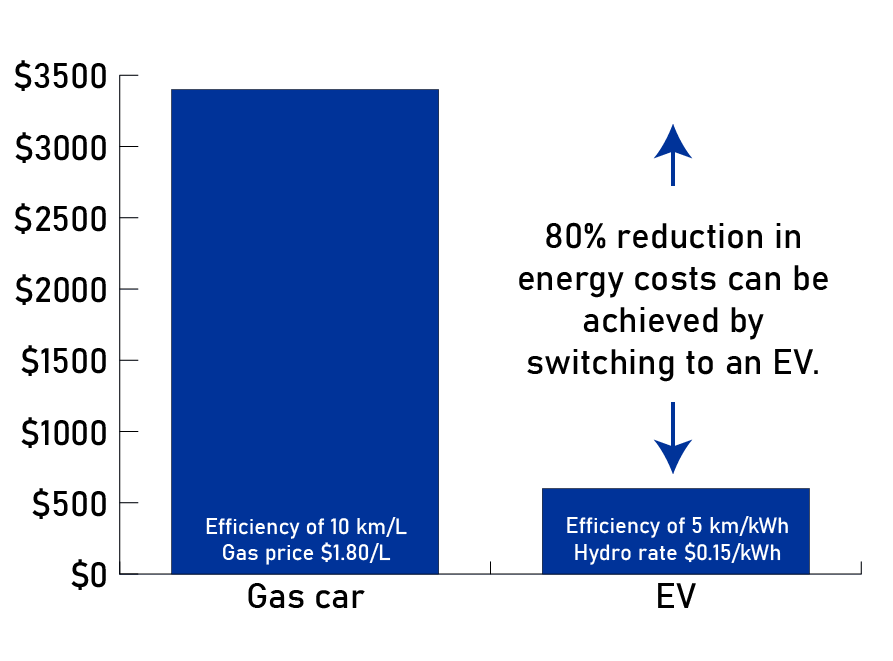
Switching to an EV can reduce energy costs by up to 80% while lowering your carbon footprint. EVs have lower operating costs, fewer moving parts, and no oil changes, making them more reliable and cost-effective in the long run. With expanding charging infrastructure and BC Hydro rebates, owning an EV is becoming more convenient and affordable than ever. Plus, driving electric helps cut air pollution and reduce dependence on fossil fuels, contributing to a cleaner, more sustainable future. However, charging remains a key barrier to EV adoption—43% of Canadians who don’t own an EV cite “lack of access to home charging” as a major obstacle. This highlights a crucial opportunity for building managers to improve resident satisfaction by enabling convenient EV charging solutions.
Long parking dwell times allows for trickle charging
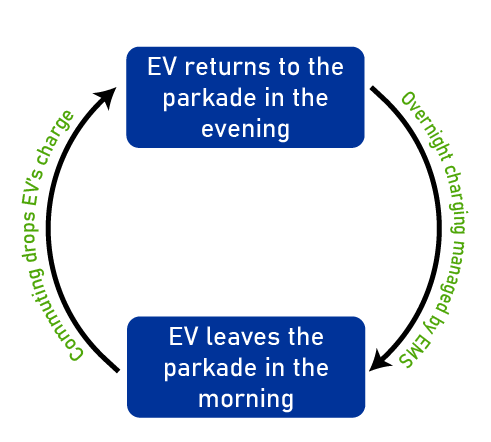
EVs spend most of their time parked—especially overnight. With limited capacity but plenty of time, power sharing between chargers can ensure that each EV gets enough charge to meet daily commuting needs. The ideas is that on workdays, the EVs replenish the small amount of energy used during their daily commute with a trickle charge during the night. And by the end of the weekend, when they’ve been parked for even longer, they’ll have a full charge by Monday morning.
How energy management systems can help
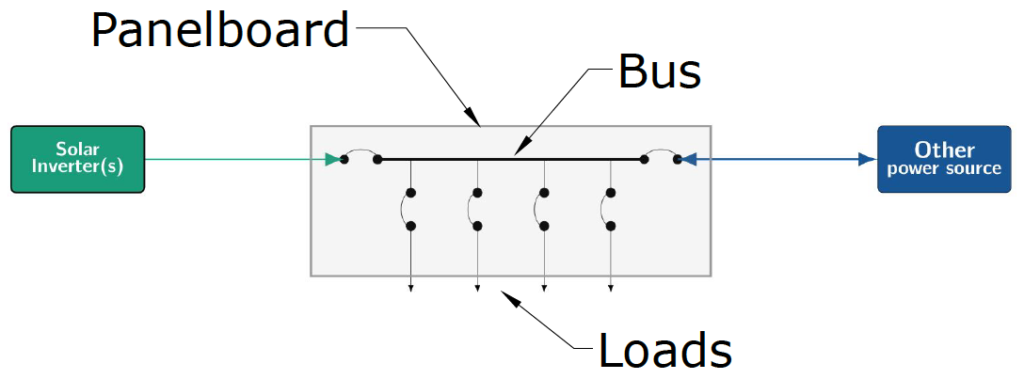
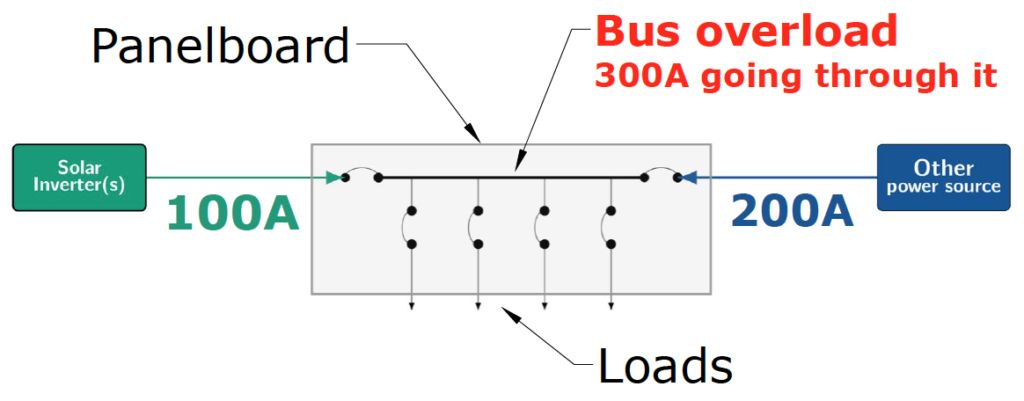
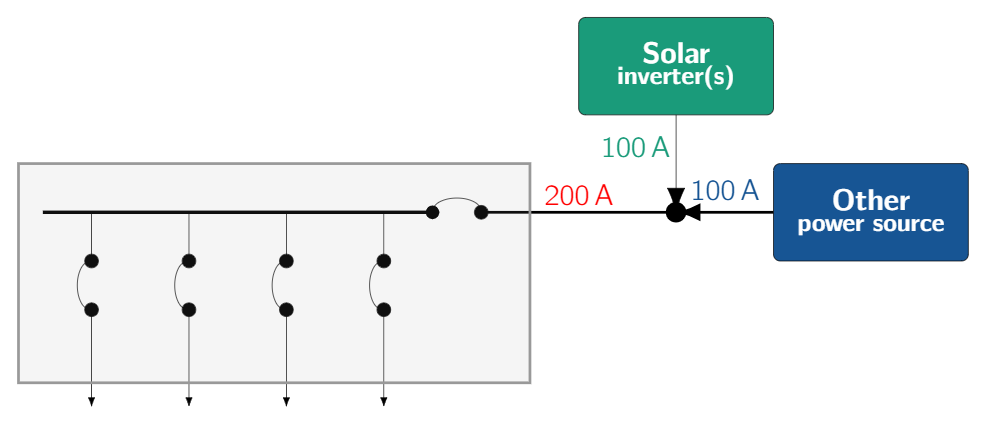
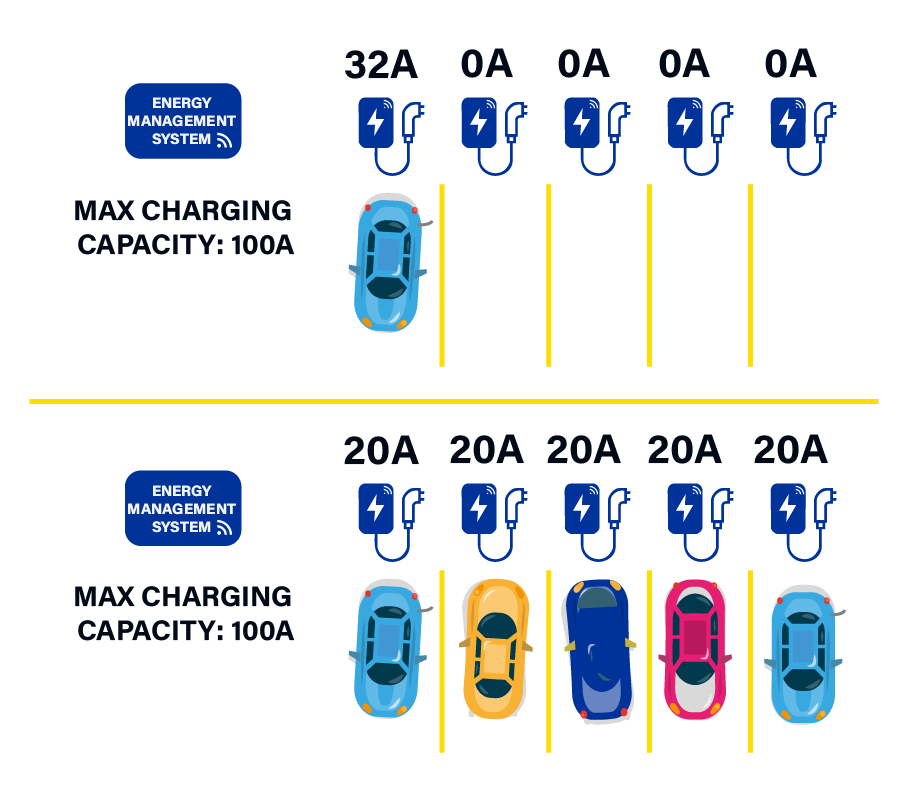
When residents return home in the afternoon and evening, they begin cooking and using other appliances which causes the building’s power demand to peak. As a result, there needs to be an energy management system (EMS) that controls the chargers and ensures that they don’t overload any of the building’s electrical equipment including panels, switches and transformers. As shown in the example below, when the charging demand exceeds the maximum charging capacity, the available power is shared among the parked EVs. This isn’t the only approach—different EMS can adopt various charging strategies, such as prioritizing EVs with very low charge levels.
Neighbour’s Multi-Unit Residential Building Charging Simulator
We developed a simulator to help building managers and stratas determine the amount of charging power needed to keep their residents’ EVs adequately charged, before committing to costly electrical upgrades. Our simulator models tenant travel patterns and predicts EV state of charge (SOC) over time, providing data-driven insights for smarter charging infrastructure planning. It simulates the behaviour of each EV tenant as well as the building’s overall demand, accounting for unique factors such as each resident’s expected daily departure time, arrival time, and energy consumption.
The simulation treats these variables as random to reflect real-world behavior and simulated the role of the chargers’ energy management system. It checks building demand while allocating power to each EV. The simulation also updated each parked EV’s SOC before its departure from the parkade the next day. So for example, if an EV departed with an SOC of 80%, and used 30% during its daily commute, its arrival SOC would be 50%, and if it receives an overnight charge of 20%, its SOC the next day when it leaves is going to be 70%, and so on.
Below are simulation results for a parkade for a 16 storey building in New Westminster with approximately 100 units. The parkade is going to be home to 20 EVs and will have maximum charging demand equivalent to only 3 chargers: 3x32Ax208V or 20kW.
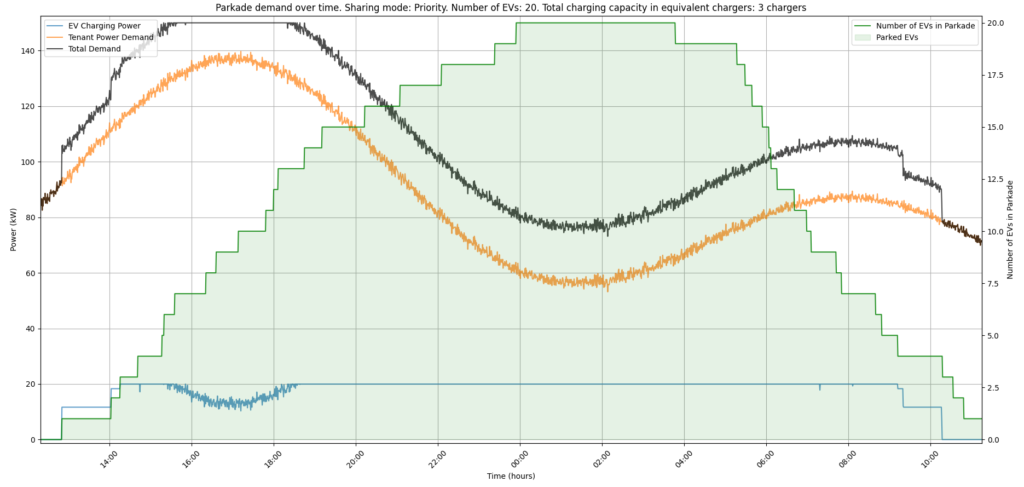
The graph above shows the building and EV demand over the course of a day. As you can see, there are two load spikes: one in the evening around 5 p.m., and another in the morning around 7 a.m. Residents start arriving around 1 p.m., plugging in their vehicles and beginning to charge. At the same time, the building’s electrical demand increases as more residents begin cooking and using their appliances. Charging power is curtailed slightly as the building’s demand reaches the supply capacity around 4:00 p.m. (150 kW), causing the total demand to flatten out, thanks to the EMS.
Below are key parameters used in modeling departure and arrival times, as well as daily energy needs. In this scenario, I assume that EVs consume an average of 25% of their state of charge (SOC) per day, or about 16.75 kWh—equivalent to a one-way commute of 40 km. This energy requirement can be refined using resident-specific data, as it heavily depends on location. For example, residents of an Abbotsford apartment building are likely to have higher energy needs than those in Burnaby if both groups typically commute to Greater Vancouver.
#Simulation parameters
initial_soc=0.75 #soc when the EVs first leave the garage
battery_capacity = 67 # kWh per EV
arrival_start_hour = 12 # Earliest arrival time
arrival_end_hour = 24 # Latest arrival time
departure_start_hour = 5 # Earliest departure time
departure_end_hour = 11.5 # Latest departure time
arrival_std = 0.25 # Standard deviation for arrival times
departure_std = 0.5 # Standard deviation for departure times
delta_on_return_mean = 0.25 # Mean delta SOC on return
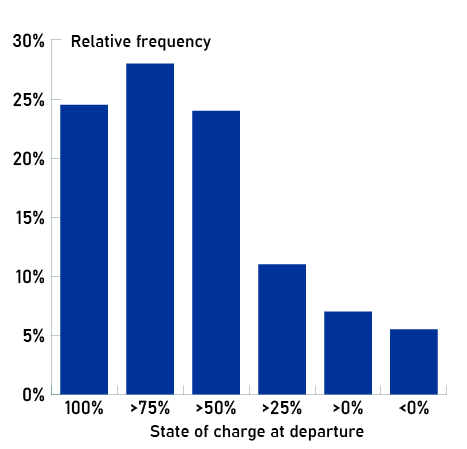
delta_on_return_std = 0.1 # Standard deviation for SOC on return And what about the EVs’ state of charge? The results were impressive. As shown in the graph opposite: by the end of the week and with the power of just three L2 charger, more than 50% of the time the 20 EVs were able to maintain a state of charge (SOC) higher than 75%. In less than 8% of instances of EVs leaving the parkade, they had less than 25% charge, of which about 5% had no charge at all, suggesting that some residents will have to be supplemented by charging elsewhere.
The table on the right is a general approximation approach to how much power is needed to maintain a certain number of EVs in the parkade with the parameters noted above. These parameters are refined or replaced with individual resident data if available, which will help to provide for a more optimal supply design.
| Number of EVs parked in the parkade overnight | Required charging capacity in equivalent L2 (32A, 208V) chargers |
| 1-5 | One charger |
| 5-10 | Two chargers |
| 10-20 | Three chargers |
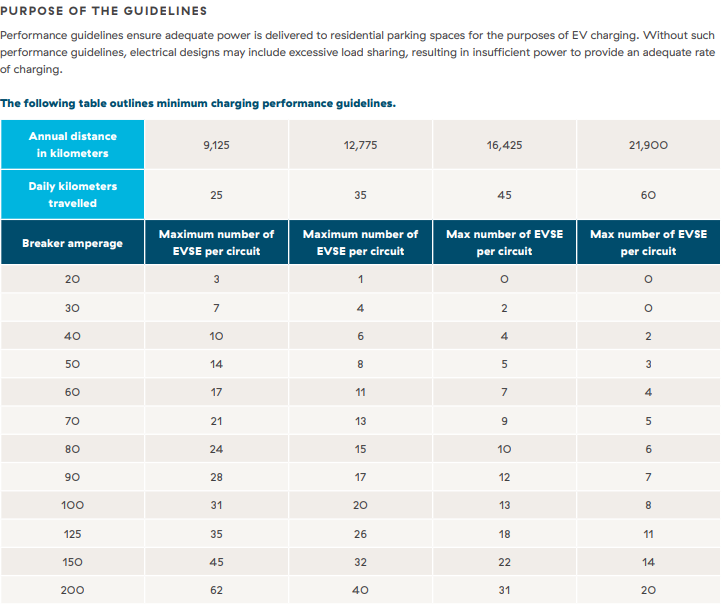
BC Hydro minimum charging performance guidelines
BC Hydro provides several guides for EV charging in residential parkades, including one on preparing for the EV Ready Plan Requirements. It includes a table (shown below) that squares the required supply capacity of a parkade with the annual distance travelled by the building’s tenants. These minimum charging performance guidelines are a great starting point for building managers and stratas approximating their future requirements. For example it suggests that a 100A breaker, which would have a capacity roughly equal to three chargers used in the simulation above, can support up to 31 EVs if they travel only 25 km per day.
Smart planning: simulation optimizes EV charging supply capacity
Planning to electrify a parkade for its residents’ existing or future EVs involves assessing its existing electrical service, building demand patterns, and then making recommendations for equipment and services suited to a building’s operating and administrative needs. Determining the right electrical supply capacity for EVs in the parkade isn’t just about avoiding unnecessary upgrade costs—it’s also key to minimizing overall electrical expenses, including operating demand charges that large electrical customers pay for. If you’re interested in exploring EV charging options for your parkade, let’s have a conversation.